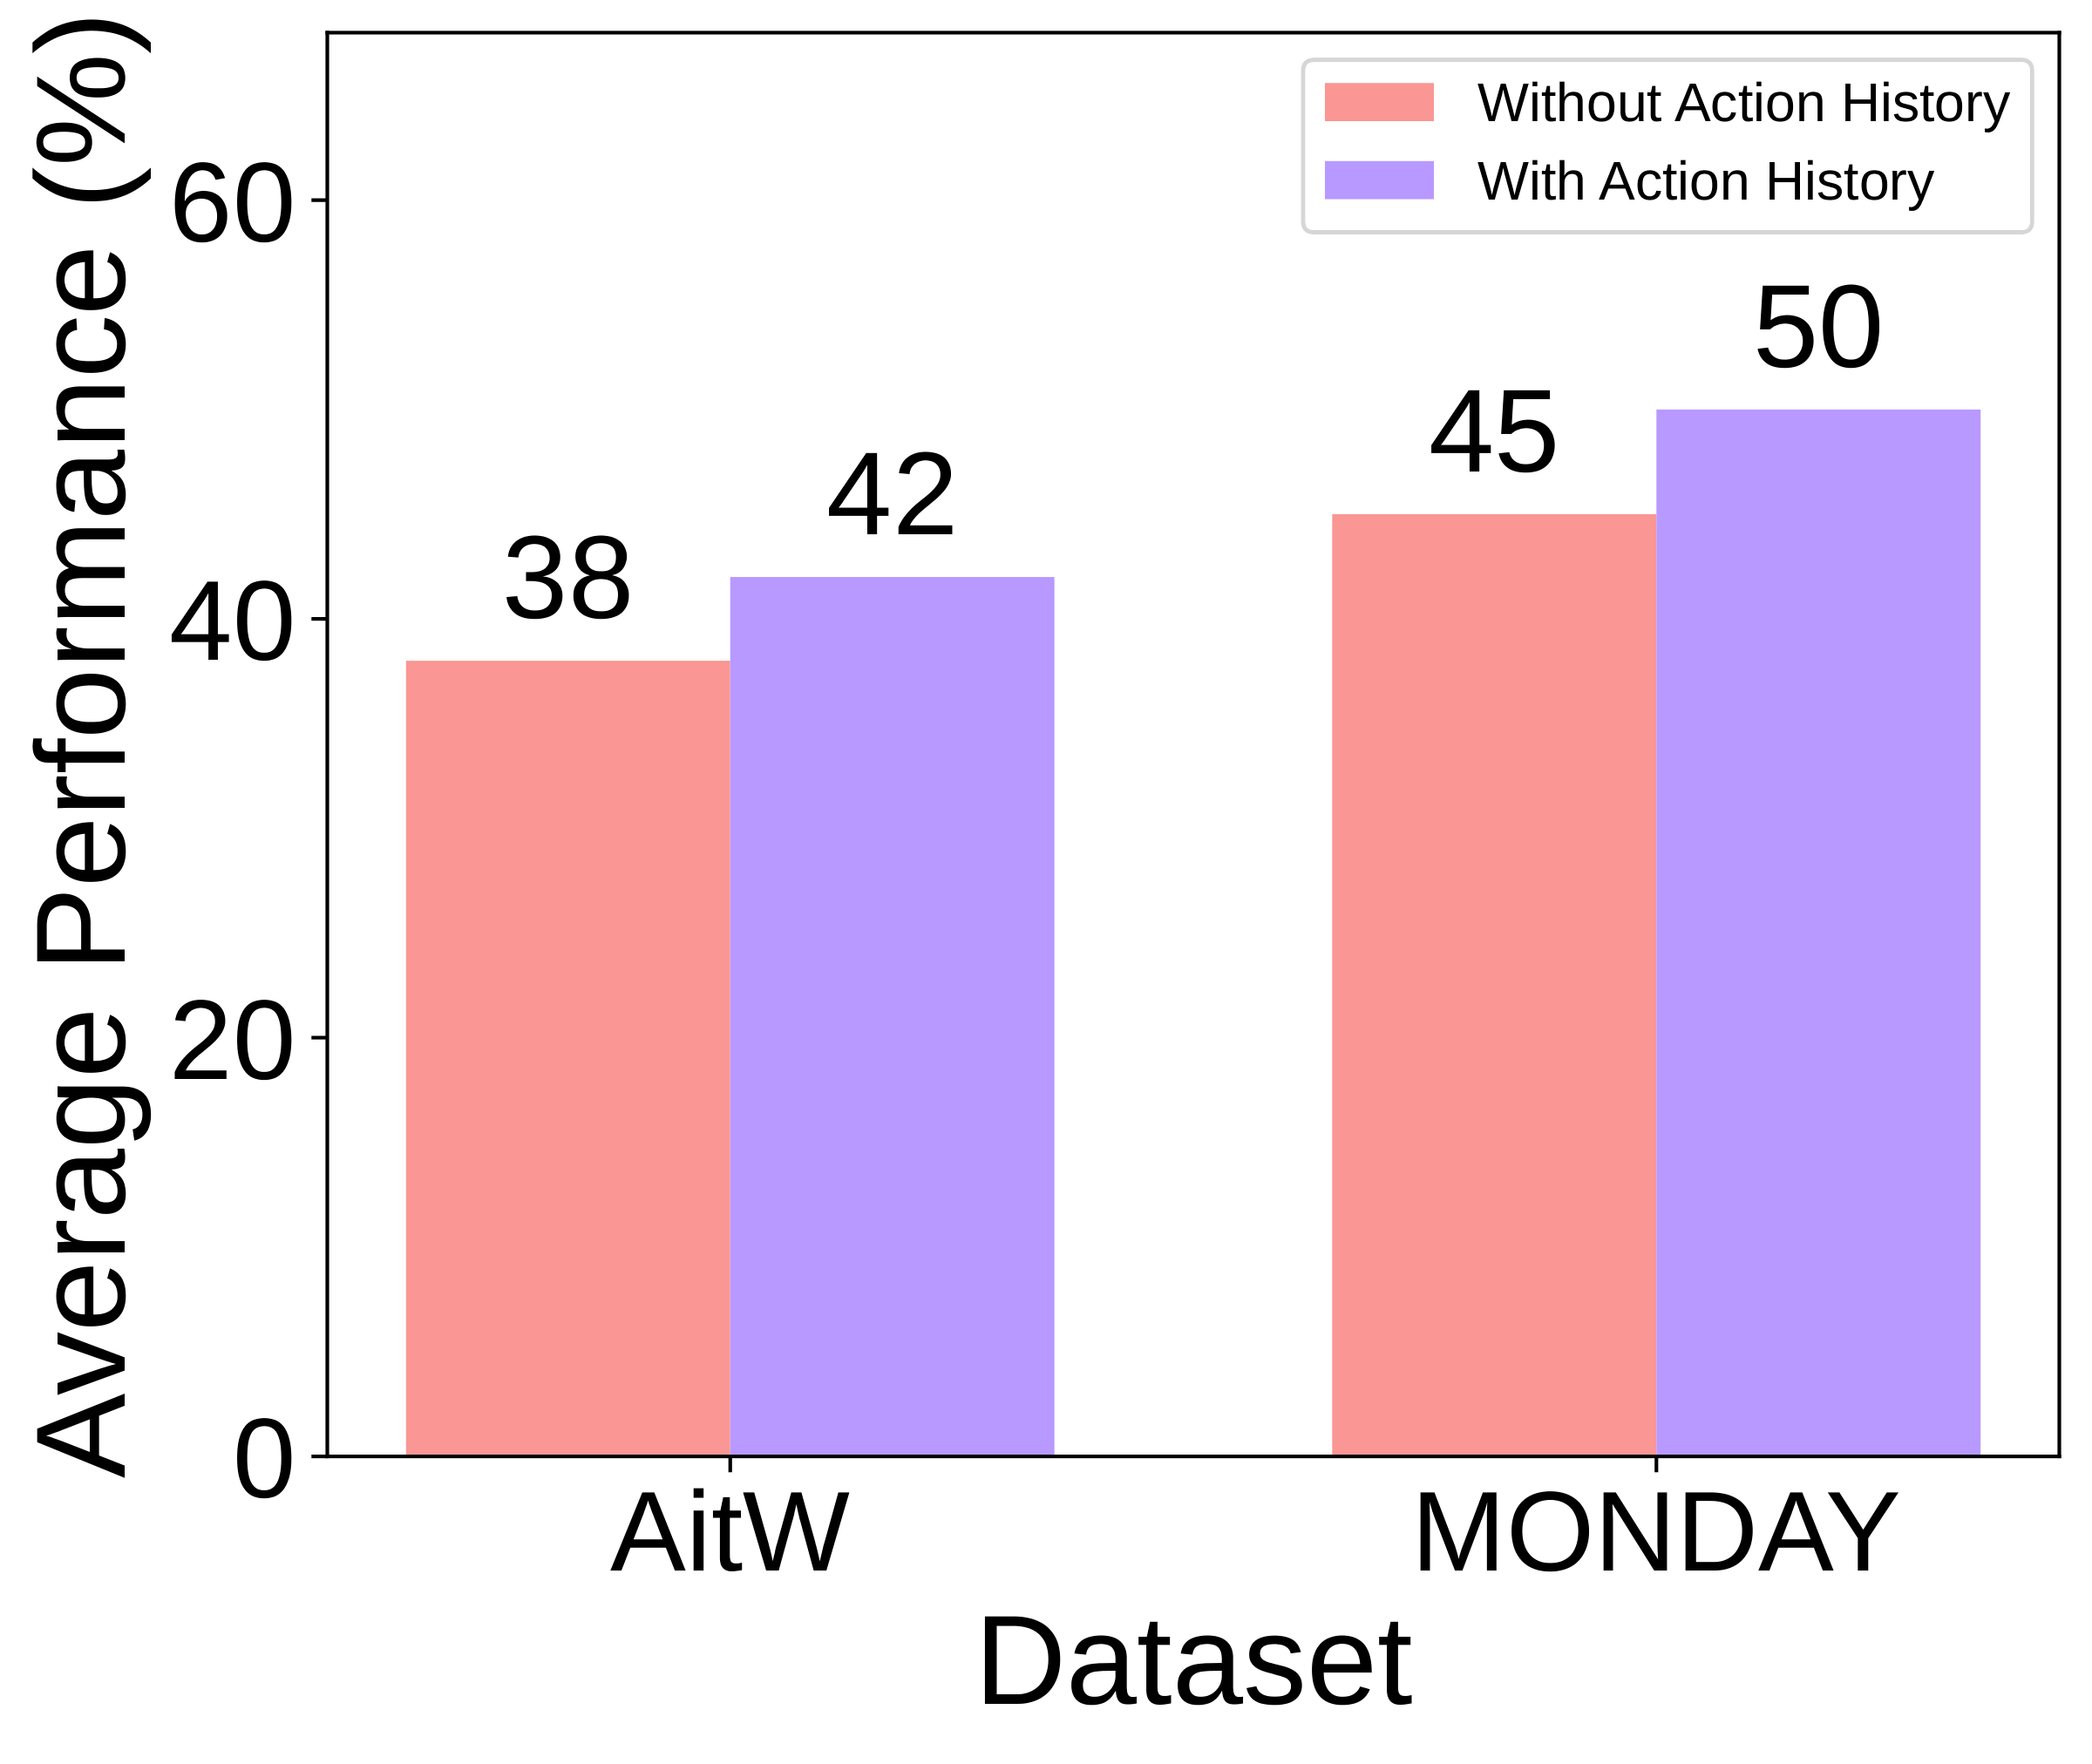
Action history improves web-agent decisions
Across five models, including previous actions improves performance on AitW and MONDAY. The figure shows average accuracy with and without action history.
Model performance, rank correlations, ablations, and error analysis from the AgentVQA paper.
The best overall accuracy is 58.5%. No single model leads across all five domains.
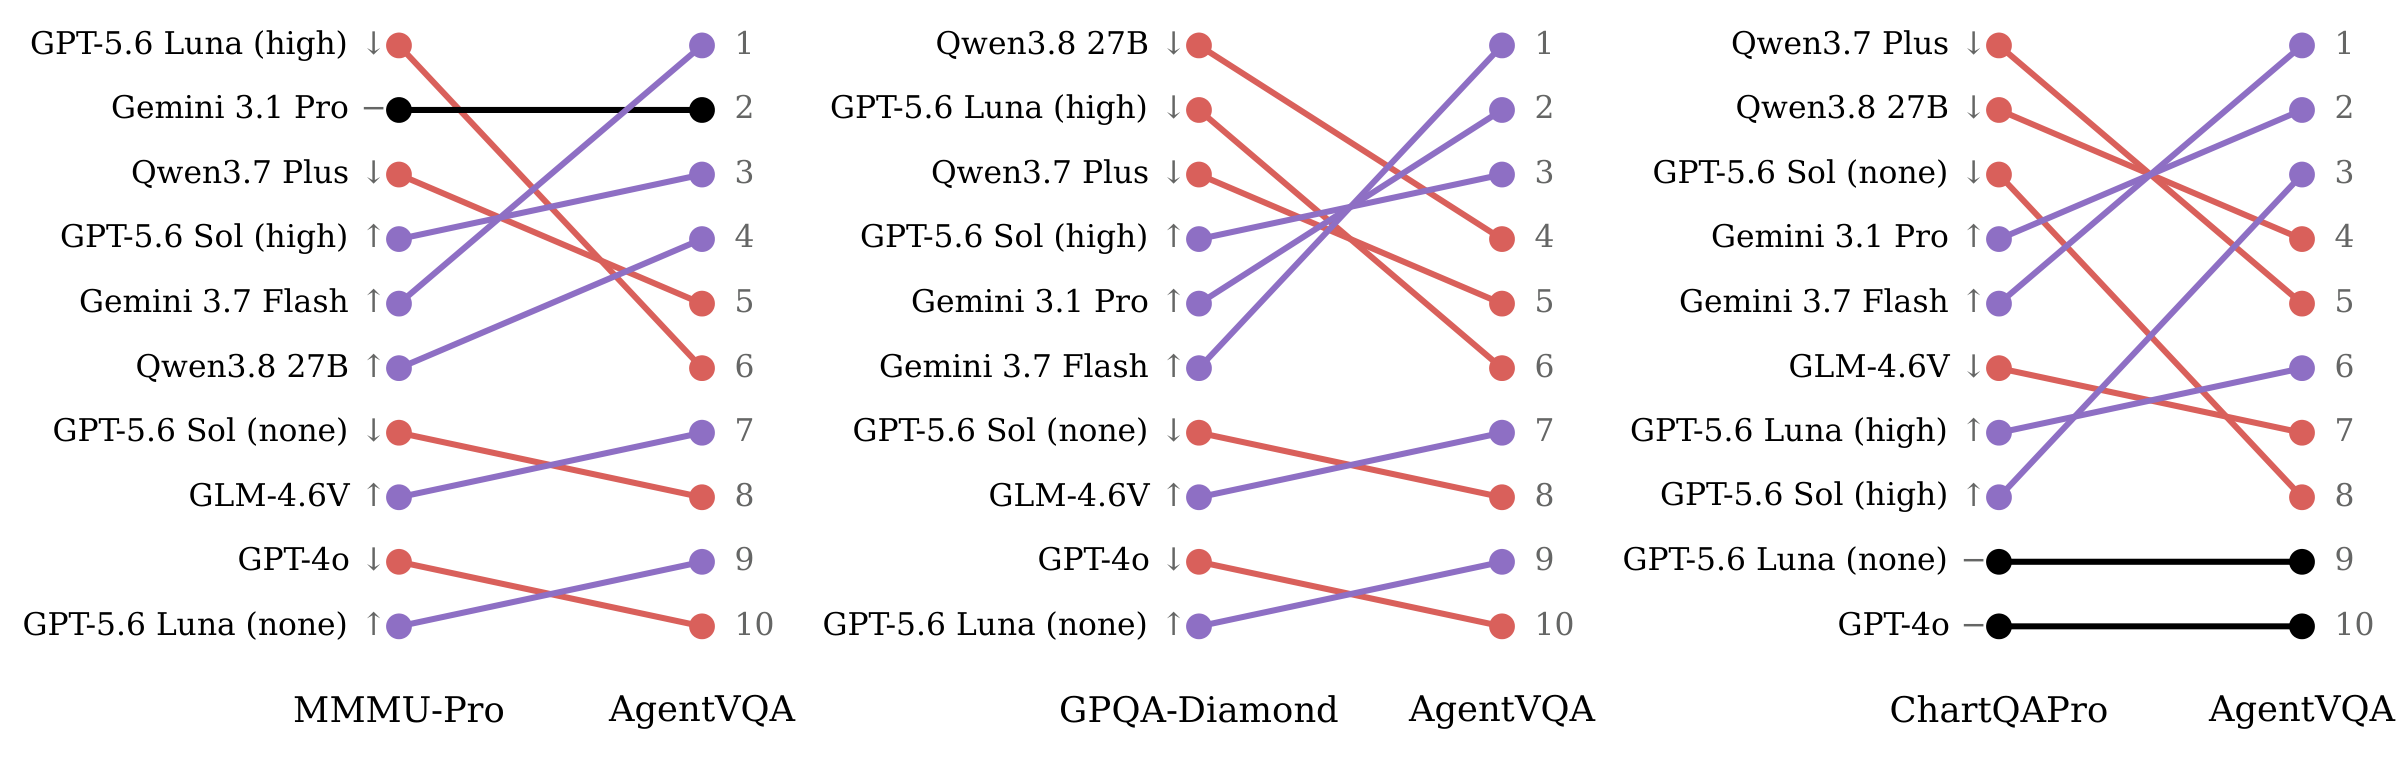
We compare model rankings on AgentVQA with general reasoning benchmarks and an online agent benchmark.
The paper evaluates matched subsets with standardized prompts. Model rankings shift across MMMU-Pro, GPQA-Diamond, and ChartQA-Pro, with moderate to weak rank correlations.
Spearman’s ρ · 10-model comparison
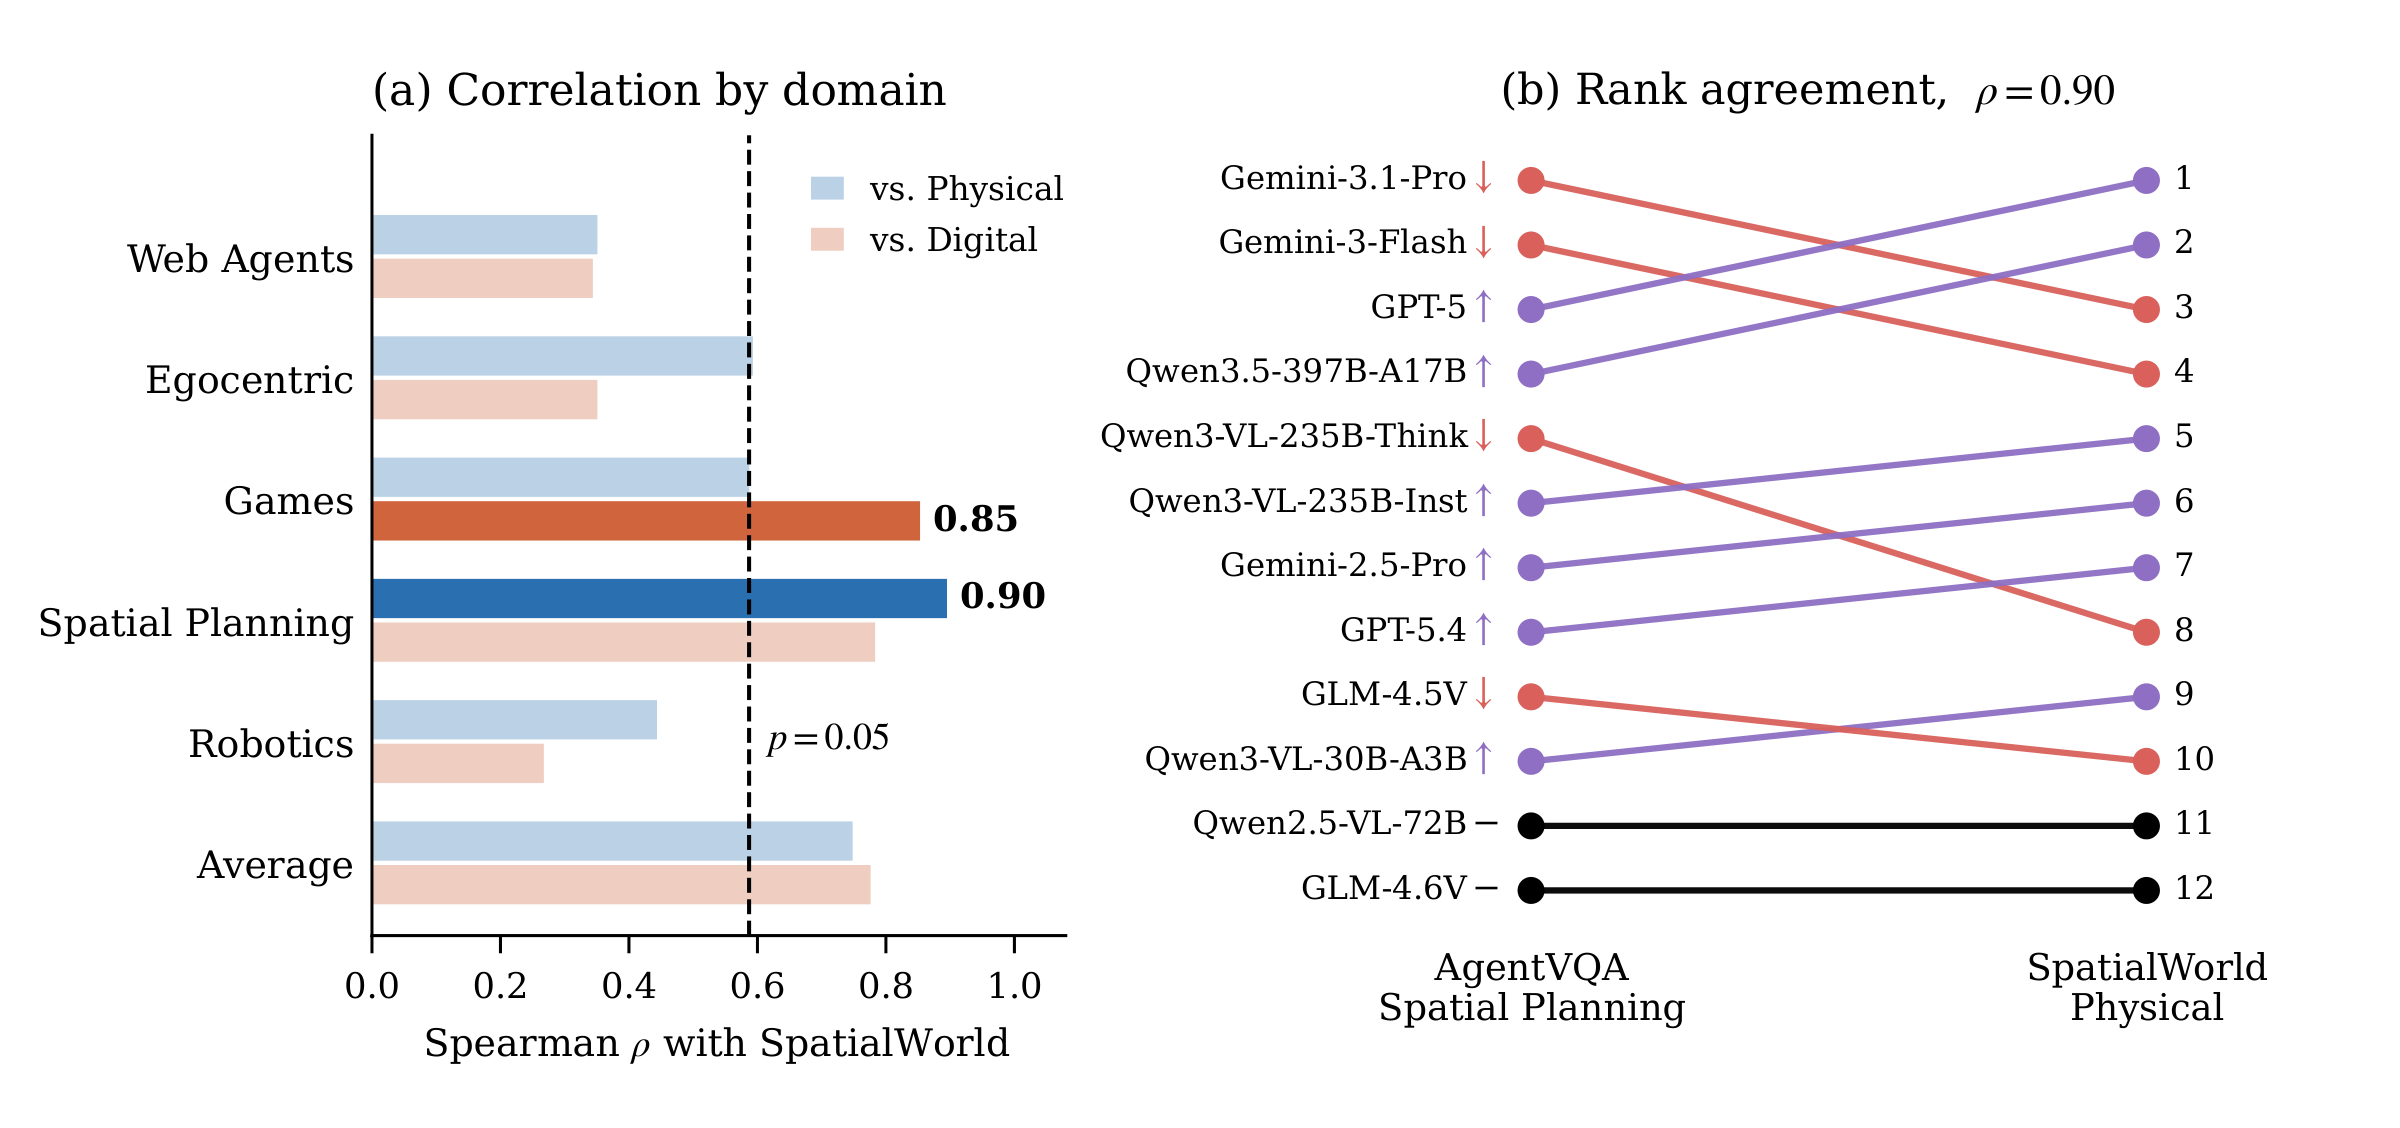
AgentVQA Spatial Planning and the SpatialWorld Physical track agree strongly across their 12 shared models. This is a separate overlapping-model cohort from the main 22-configuration evaluation.
Across five models, including previous actions improves performance on AitW and MONDAY. The figure shows average accuracy with and without action history.
Extended reasoning improves both GPT-5.6 variants, but GLM-4.1V-9B-Thinking trails its base counterpart. Accuracy alone does not tell the full story of how models use extra computation.
| Model | None / Base | High / Thinking | Δ (pp) |
|---|---|---|---|
| GPT-5.6-sol | 38.2 | 55.0 | +16.8 |
| GPT-5.6-luna | 32.8 | 47.9 | +15.1 |
| GLM-4.1V-9B | 36.3 | 35.4 | −0.9 |
Δ is the difference in percentage points. The paper also documents “thinking loops” in GLM-4.1V-Thinking.
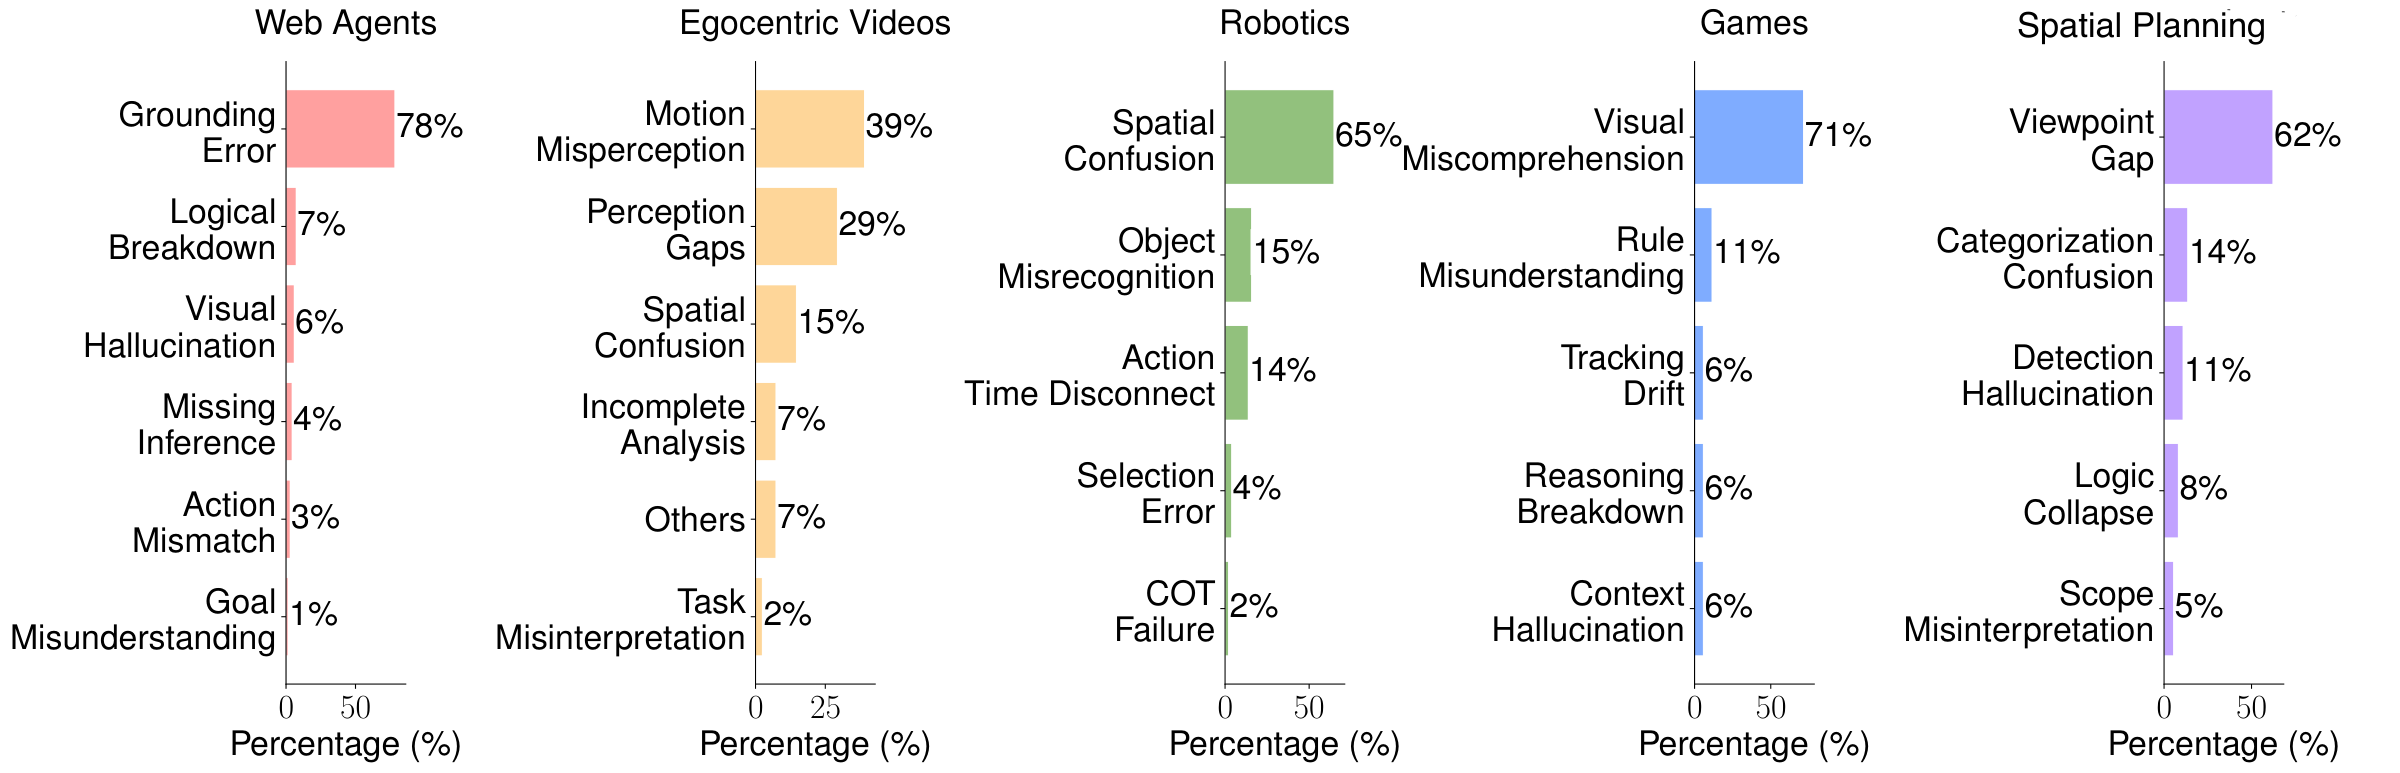
The paper analyzes incorrect Gemini 3.1 Pro predictions sampled approximately evenly across datasets. Error categories are model-assisted and manually verified.
| Domain | Most common error | Share of analyzed errors |
|---|---|---|
| Web Agents | Grounding error | 78% |
| Egocentric Videos | Motion misperception | 39% |
| Robotics | Spatial confusion | 65% |
| Games | Visual miscomprehension | 71% |
| Spatial Planning | Viewpoint gap | 62% |
Percentages are shares of the analyzed errors within each domain—not error rates across all questions.